
Average household expenses in Switzerland, BFS explained
Per the BFS Household Budget Survey 2023, the average household has a gross income of around CHF 10'341 and CHF 7'186 disposable. Biggest items: obligatory expenses CHF 3'154 (30.5 %), housing and energy CHF 1'449 (14.0 %), groceries at home around CHF 638 (6.2 %). What remains is a savings amount of CHF 1'736 per month (16.8 %).
Rappn compares the current promotions of 7 Swiss retailers, updated daily: free, no subscription.
Track your grocery spending in Rappn, free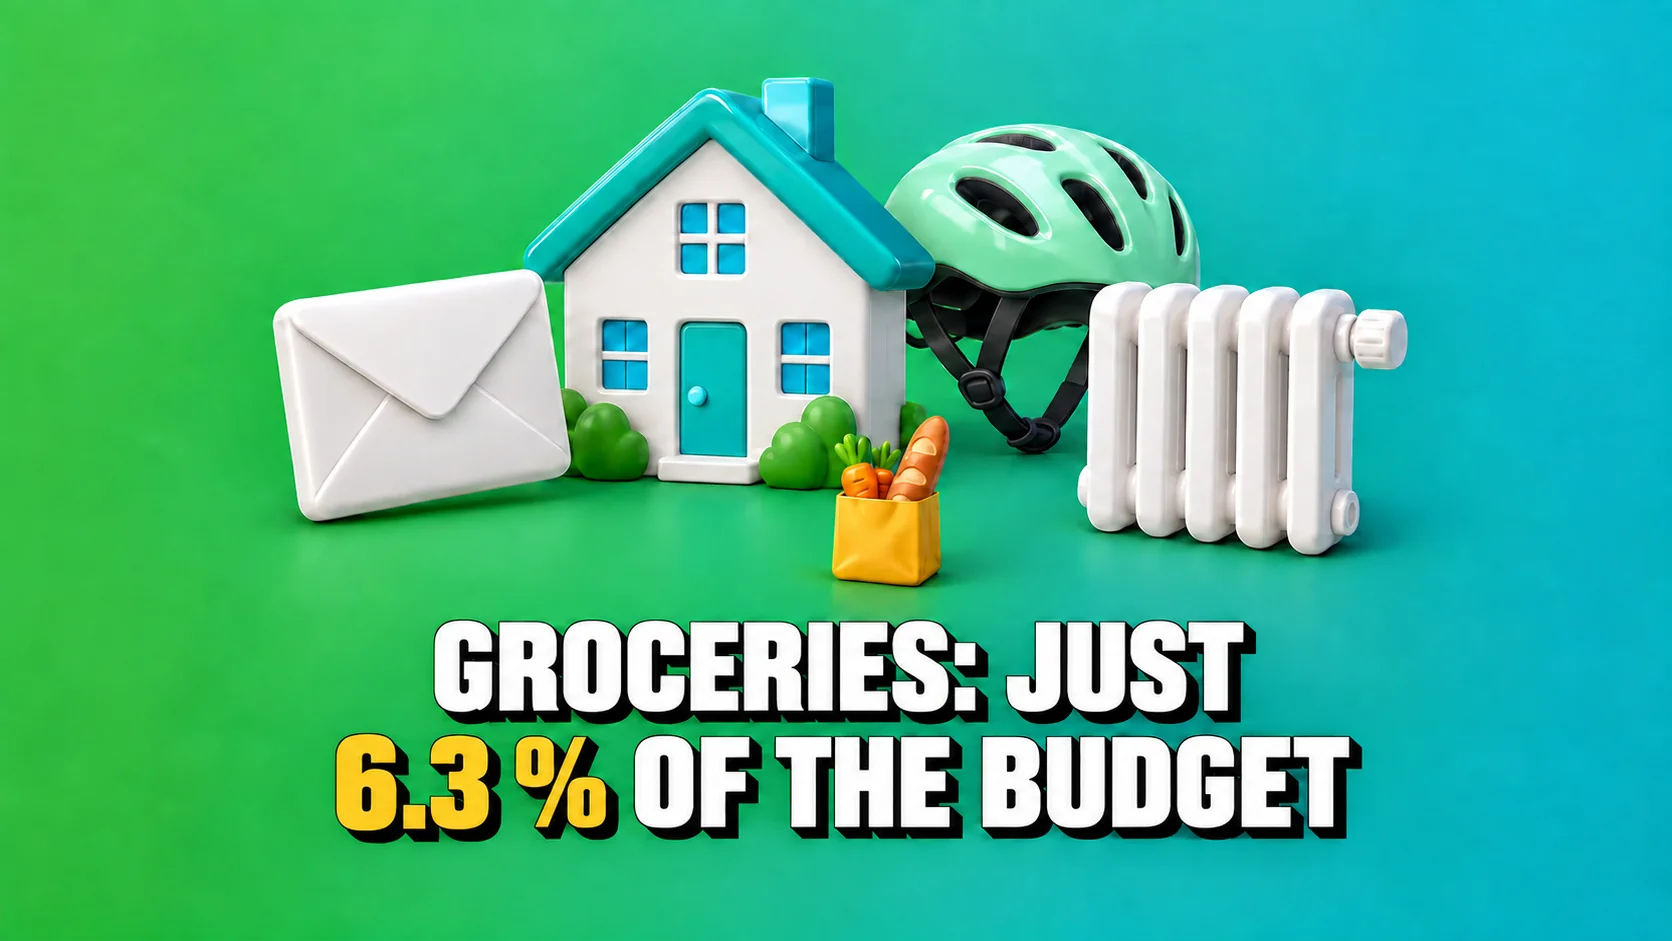
How much does a Swiss household spend on average, and on what? The most reliable source is the Household Budget Survey (HABE) from the Federal Statistical Office (BFS). The latest edition (2023 reporting year, published November 2025) works with an average gross income of around CHF 10'341 per month and a disposable income of CHF 7'186. Here is the full breakdown, and the one line you can act on immediately.
Rappn is an independent grocery price comparison app in Switzerland, with no commercial agreement with any retailer. Migros, Coop, Aldi, Lidl, Denner, Aligro and Otto's do not pay us to rank them, and nothing below is sponsored.
How much does an average Swiss household spend per month?
| Item | Avg CHF per month | Share of gross income |
|---|---|---|
| Gross income | ~10'341 | 100 % |
| Obligatory expenses (taxes, social ins., health) | 3'154 | 30.5 % |
| Housing and energy | 1'449 | 14.0 % |
| Groceries at home | ~638 | 6.2 % |
| Savings amount | 1'736 | 16.8 % |
This is Rappn's spending view: scan your receipts to see how your household compares to the BFS average, and where your groceries really go. Tap around to try it.
Track your grocery spending in Rappn, freeFree, no subscription · iOS & Android
Your spending
What the average says, and what it doesn't
The average household counts about two people; larger families and single-person households diverge sharply. Important: not everyone can save. Households in the lowest income bracket often spend more than they earn, a negative savings amount, according to BFS. That is exactly why the variable line matters: housing, taxes and social insurance are fixed in the short term, but groceries you buy again every week. If your own food line sits above CHF 638, it is the fastest lever to get closer to the average or below it, without giving anything up.
Why your household can differ sharply from the average
The average blends very different households into a single figure, so it rarely matches your situation exactly. It is a statistical mean, not a real household. Three factors pull your actual budget furthest from the national average:
- Household size: a person living alone and a family of four sit behind the same average. Food, living space and almost every line scale with the number of people, so the CHF 638 food figure means little for either extreme.
- Region: the CHF 1'449 for housing and energy is a nationwide mean. In Zurich or Geneva rent is far higher than in a rural canton, so two households on the same income keep very different amounts.
- Income level: the average savings amount of CHF 1'736 assumes room to save. On a lower income the obligatory charges of 30.5 percent weigh more heavily and often little or nothing is left at month's end, while a higher income keeps more even at the same percentage.
So treat the average as rough orientation, not a target or a reproach. Whether you land above or below it depends on factors you barely control. What really decides your month is your own receipts, not the national mean. That is exactly what the Rappn spending scan makes visible, so you can target your one movable line, groceries.
In the Rappn app you scan your receipts and see how much you really spend on groceries, instead of guessing. And through the price comparison you lower that line week by week. For which of the big expenses you can actually influence, see the biggest household expenses, and for how much to set aside each month, see how much to save per month.
Updated: .
Why Rappn?
Rappn is an independent grocery price comparison app in Switzerland, with no commercial agreements with any retailer. Our comparisons are truly independent.
- 100% free: no subscription, no hidden costs
- Neutral: no commercial agreements with Migros, Coop, Aldi, Lidl, Denner, Aligro, or Otto’s
- Updated daily, as soon as the chains publish their deals
- The chains’ deals in one place: search, filter, compare, no subscription
- Meal planner in the Kitchen tab: plan the week, send the ingredients to your list

Ready to save on groceries?
Install Rappn and compare for yourself this week. No account required.Scan the code, install Rappn and compare current offers. No account needed.



Frequently Asked Questions
How much does an average Swiss household spend per month?
On a gross income of around CHF 10'341 per month, BFS (HABE 2023) shows 30.5 percent going to obligatory expenses alone (CHF 3'154: taxes, social insurance, health premiums). The largest consumption item is housing and energy at CHF 1'449. What remains is a savings amount of CHF 1'736 per month.
What percentage of income goes to groceries?
Around 6.2 percent of gross income, roughly CHF 638 per month, for food and non-alcoholic drinks at home (BFS HABE 2023). Including eating out, restaurants and take-away, the total rises noticeably further.
What is the average disposable income?
Around CHF 7'186 per month, after obligatory expenses are deducted from the gross income of around CHF 10'341 (BFS HABE 2023, reporting year 2023, published November 2025).
Does every household actually save money?
No. On average the savings amount is CHF 1'736 per month (16.8 percent), but households in the lowest income bracket often spend more than they earn, per the BFS Household Budget Survey 2023. The average hides large differences.
Does the average apply to my household?
Only loosely. The same average hides both a single person and a family of four, and rent varies widely by region. Household size, location and income shift your figures noticeably, so treat the average as a guide, not a target.