How much do you need for food each month? The Swiss benchmark
The average Swiss household (2.07 people) spends about CHF 638 a month on food and non-alcoholic drinks at home, 6.2% of gross income (Federal Statistical Office, Household Budget Survey 2023). By household type, spending ranged from about CHF 337 for a person under 65 living alone to about CHF 1'102 for a couple with three or more children; couples with children spent about CHF 923 on average (FSO 2018-2019, the last years before Covid). For planning, Budgetberatung Schweiz gives CHF 370 to 1'250 a month, depending on household type and net income (2025/2026).
Rappn compares the current promotions of 7 Swiss retailers, updated daily: free, no subscription.
Track your food budget in Rappn, free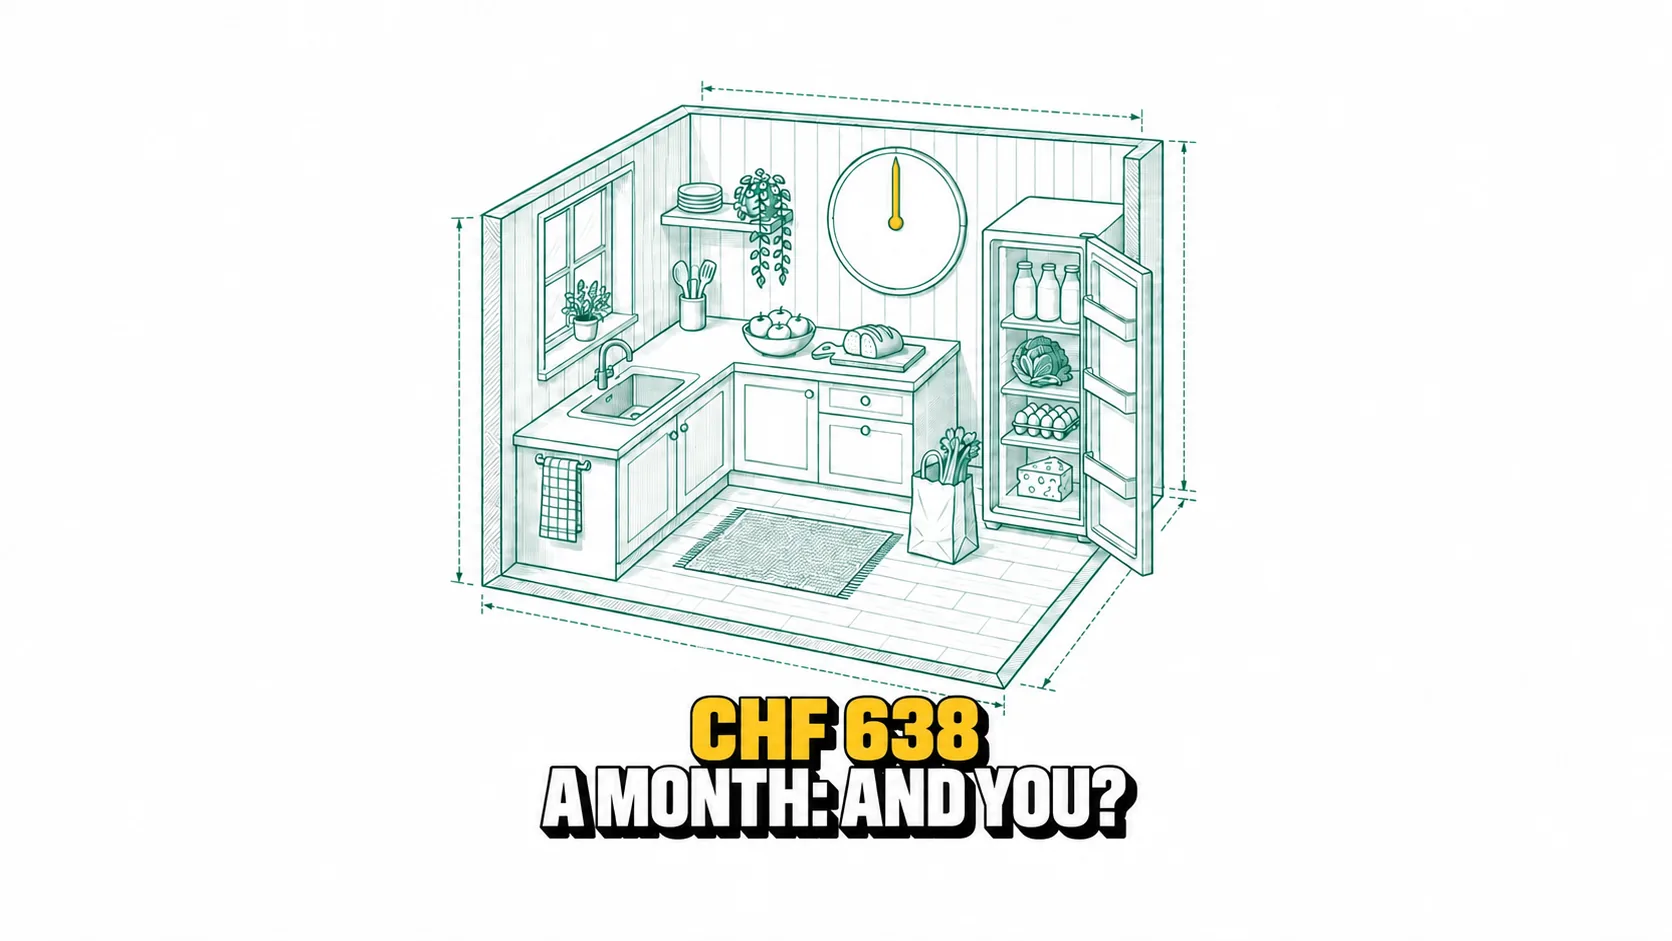
A Swiss household spends on average about CHF 638 a month on food and non-alcoholic drinks consumed at home: the 2023 average of all households, which have 2.07 people on average, and 6.2% of gross household income (Federal Statistical Office, FSO). What is normal for you depends mostly on who lives with you: in 2018-2019, the last years before Covid, it ranged from about CHF 337 a month for a person under 65 living alone to about CHF 1'102 for a couple with three or more children; couples with children spent about CHF 923 on average. For planning, Budgetberatung Schweiz, the Swiss budget counselling association, gives guideline values of CHF 370 to 1'250 a month, depending on household type and net income.
Updated October 2026. Sources: FSO, Household Budget Survey (HBS), 2023 results (press release of 17 November 2025, table T1), tables by household type T20.02.01.00.13 and couples with children by number of children T20.02.01.00.43 (both 2018-2019 and 2020-2021), time series T20.02.01.00.01 and detailed household spending 2023; Budgetberatung Schweiz, budget examples 2025/2026 (viewed on 9 October 2026).
How much does a Swiss household spend on food per month?
| Household type | People on average (2018-2019 / 2020-2021) | FSO 2018-2019 | FSO 2020-2021 (Covid years) |
|---|---|---|---|
| All households | 2.1 | CHF 618 | CHF 665 |
| Person under 65 living alone | 1 | CHF 337 | CHF 387 |
| Person aged 65 or over living alone | 1 | CHF 403 | CHF 412 |
| Couple under 65, no children | 2 | CHF 642 | CHF 716 |
| Couple aged 65 or over, no children | 2 | CHF 742 | CHF 795 |
| Single parent | 2.7 / 2.6 | CHF 622 | CHF 648 |
| Couple with children | 3.9 / 3.8 | CHF 923 | CHF 968 |
Food and non-alcoholic drinks at home, average in Swiss francs (CHF) per household per month, rounded (FSO, table T20.02.01.00.13). 2023 average of all households: CHF 638 for 2.07 people; the FSO has not published household types for 2023 and has announced the 2022-2024 series for November 2026. By number of children, with the guidelines alongside, the figures are in the grocery budget by household size.
Per person that is about CHF 309 a month in 2023 (637.76 ÷ 2.066 people), or about CHF 10 a day (309 ÷ 30.4 days): our own calculation, not an FSO figure. Do not multiply it by the number of people, because each person spends less as the household grows: a couple with two children spent CHF 955 a month in 2018-2019, not 4 × 309. The daily figure, per person and per household type, is worked out in the guide to food cost per day.
Scan your receipts in Rappn and view recorded spending by category. Review your grocery budget using your own purchases.
Track your food budget in Rappn, freeFree, no subscription · iOS & Android
Your spending
How much should you budget for food each month?
| Household type | Guideline 2025/2026 per month |
|---|---|
| Single person | CHF 370 to 500 |
| Couple | CHF 550 to 700 |
| Family with 1 child | CHF 700 to 850 |
| Family with 2 children | CHF 850 to 1'100 |
| Family with 3 children | CHF 1'000 to 1'250 |
| Single parent with 1 child | CHF 500 to 650 |
| Single parent with 2 children | CHF 700 to 850 |
| Single parent with 3 children | CHF 850 to 1'000 |
Source: Budgetberatung Schweiz, budget examples 2025/2026, from the lowest to the highest net income in each example. Add CHF 50 to 100 a month for each child aged 12 or over. The measured average and the guideline answer different questions: the first says what the surveyed households spent, high incomes included, the second how much to plan for. For a couple with two children, the details are in the family of four grocery budget.
Are you above or below the benchmark?
The average only says what is usual, not what is necessary. Whether your food budget is high or low only becomes clear once you know your real spending instead of guessing it, and compare it with the row for your household type, not with CHF 638. Three things often explain a gap. Eating out comes on top: in 2023 households spent another CHF 558 a month on restaurants and accommodation and CHF 92 on alcoholic drinks and tobacco (FSO). Cleaning products and toiletries are not food: Budgetberatung Schweiz puts them on a separate line. And a teenager eats more than a small child, which the guidelines reflect with CHF 50 to 100 a month per child aged 12 or over. If you are above the row for your household, this is the line you can steer week by week: compare the price per kilo or litre on the shelf label, not the pack price.
Where does the CHF 638 sit in the household budget?
| Budget line | Average CHF per month (FSO 2023) | Adjustable week to week? |
|---|---|---|
| Gross income | CHF 10'341 | - |
| Compulsory spending (taxes, social insurance, basic health insurance, transfers to other households) | CHF 3'154 | No, set by law or contract |
| Housing and energy | CHF 1'449 | No, fixed for months (rent or own home, service charges, energy) |
| Food and non-alcoholic drinks | CHF 638 | Yes |
| Amount left for saving (average) | CHF 1'736 | Partly |
The point is not the size but the room to move. Tax, health insurance and rent are fixed for months, and a single shopping trip does nothing to them. Food is the largest line a household can genuinely steer week by week, and the effect shows on the receipt straight away. For the whole budget, the monthly budget examples for Switzerland show complete budgets per household type, average household expenses cover every spending line and the 50-30-20 rule shows where food fits in net income.
What does the CHF 638 buy?
More than seven francs in ten go to four groups: fruit and vegetables (21%), meat (19%), bread and cereal products (16%) and milk, cheese and eggs (16%); non-alcoholic drinks take 9% (our calculations from FSO figures for 2023, for example meat CHF 120 out of CHF 638 = 19%). Item by item, the figures are in the guide to grocery spending by category.
How do you find your own figure?
If you want your own figure rather than an average, the free Rappn app imports the receipts of three big Swiss supermarkets’ loyalty programmes, up to 12 months back, and you add the others by photo; it then shows your spending by category and by month. You need a Rappn account and must be an adult; the programmes’ terms still apply and the operator can restrict the link (how linking works).
You can take the first step today: keep this week’s grocery receipts and, in the evening, photograph them or upload them from your gallery; enter purchases without a receipt by hand. Rappn is a free Swiss app (iOS and Android) that compares the current promotions of seven Swiss retailers and turns receipts into a spending overview. It sorts your purchases into categories and shows your spending by month, next to your own monthly average, and you can export your receipts as PDF or CSV. After a full month, compare your figure with the row for your household type. Rappn is independent, with no commercial agreement with any retailer, and free, with no subscription. It covers the grocery line of your budget, not rent, health insurance or taxes: for the whole budget you need a household budget template or the free tools of Budgetberatung Schweiz.
Updated: .
Why Rappn?
Rappn is an independent grocery price comparison app in Switzerland, with no commercial agreements with any retailer. Our comparisons are truly independent.
- 100% free: no subscription, no hidden costs
- Neutral: no commercial agreements with Migros, Coop, Aldi, Lidl, Denner, Aligro, or Otto’s
- Updated daily, as soon as the chains publish their deals
- The chains’ deals in one place: search, filter, compare, no subscription
- Meal planner in the Kitchen tab: plan the week, send the ingredients to your list

Ready to save on groceries?
Install Rappn and compare for yourself this week. No account required.Scan the code, install Rappn and compare current offers. No account needed.



Frequently Asked Questions
How much money should you spend on food per month?
As a benchmark, the average Swiss household of 2.07 people spends about CHF 638 a month on food and non-alcoholic drinks at home, 6.2% of gross income (Federal Statistical Office, 2023). By household type, spending ranged from about CHF 337 for a person under 65 living alone to about CHF 1'102 for a couple with three or more children (2018-2019); for planning, Budgetberatung Schweiz gives CHF 370 to 1'250 a month (2025/2026).
How much does a single person spend on groceries?
A person under 65 living alone spent about CHF 337 a month on food at home in 2018-2019 and CHF 387 in the Covid years 2020-2021 (Federal Statistical Office). For planning, Budgetberatung Schweiz gives CHF 370 to 500 a month for a single person, depending on net income (2025/2026).
Does the Federal Statistical Office publish food spending by number of people?
No. The Federal Statistical Office publishes spending by household type (living alone, couple, couple with children, single parent), not by plain headcount. The type closest to a four-person household is the couple with two children, 4.0 people on average, which spent CHF 955 a month in 2018-2019.
Why are the 2020-2021 figures higher?
Because of Covid: households ate at home more often and in restaurants less. Couples with children spent CHF 968 a month on food at home in 2020-2021, up from CHF 923 in 2018-2019, and CHF 553 on restaurants and accommodation, down from CHF 764 (Federal Statistical Office). That is why 2018-2019 remains the reference.
What share of income do Swiss households spend on food?
In 2023, food and non-alcoholic drinks took 6.2% of gross household income and about 8.9% of disposable income (CHF 638 ÷ CHF 7'186, our calculation from Federal Statistical Office figures), for the average household of 2.07 people.
How do I find out if my food budget is too high?
By measuring your real spending rather than guessing it. In the free Rappn app you photograph a receipt, upload it from your gallery or enter a purchase by hand, and you see your spending by category and by month, next to your own monthly average. Then compare that figure with the row for your household type, not with the CHF 638 average of all households.